
Fig 5. Histogram of p-values (-log2 scale) calculated for TFBSs of clustered gene groups vs random groups of genes of the same size.
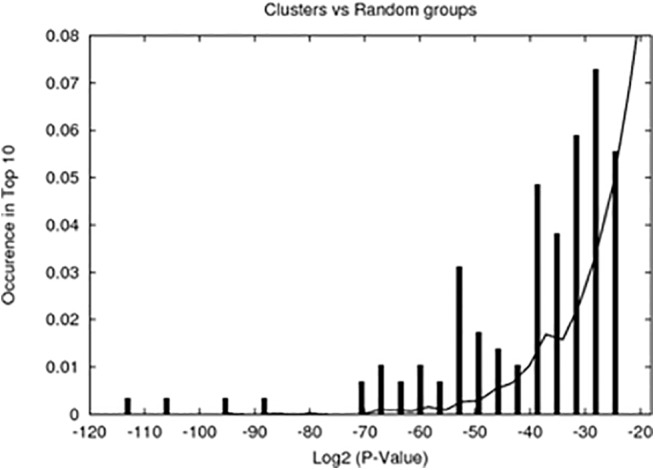
TFBS overrepresentation p-values for clustered gene groups are shown as impulses, for random groups—as lines. According to this comparison, TFBSs assigned to the group with overrepresentation p-value less than 10−9 (log2P<-29.9) can be considered to be less likely to appear by a chance.