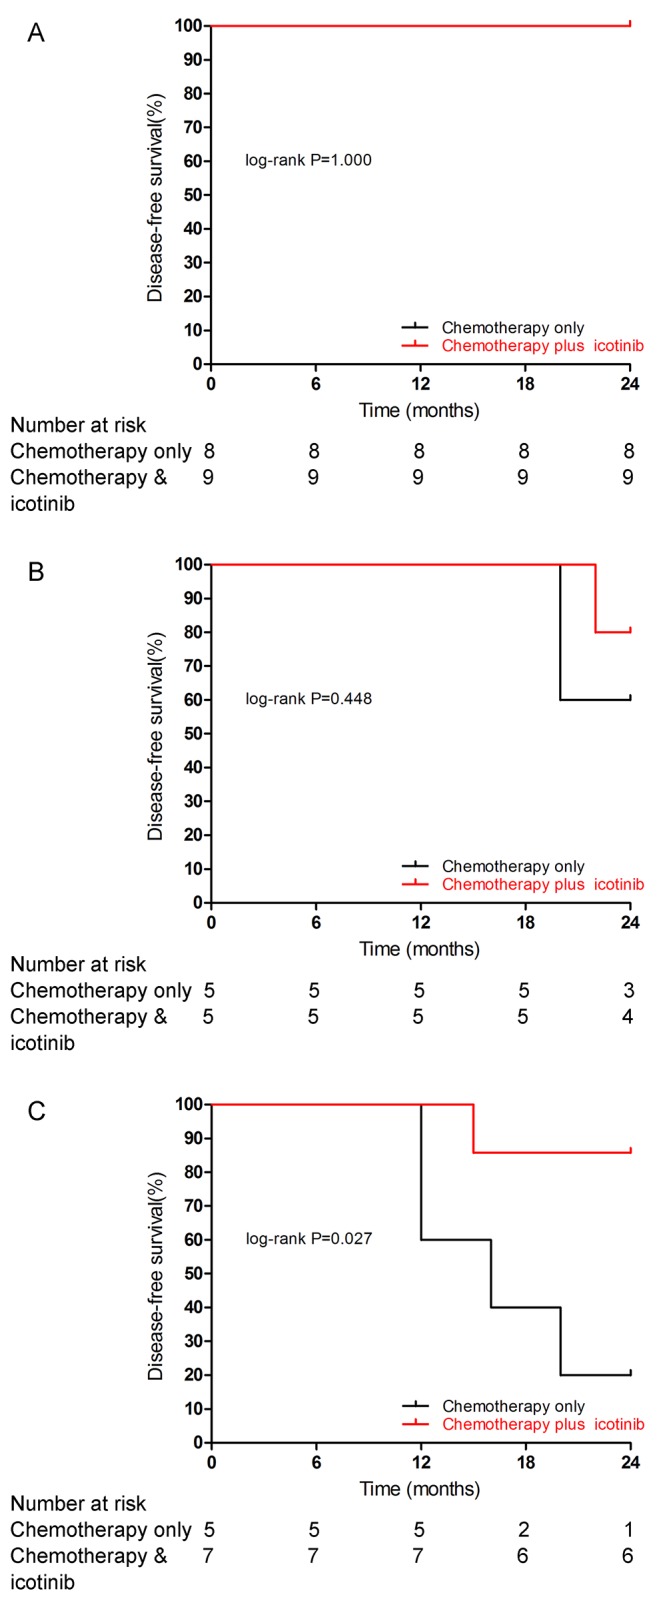
Fig 3. Kaplan-Meier curves for disease-free survival in subgroups.

Kaplan-Meier curves for disease-free survival by treatment arm are shown for patients with stage IB (A), Ⅱ (B) or ⅢA (C) NSCLC.

Kaplan-Meier curves for disease-free survival by treatment arm are shown for patients with stage IB (A), Ⅱ (B) or ⅢA (C) NSCLC.