
Fig 5. Guardant360 samples stressed by prolonged storage time and high temperature cycling do not impact performance.
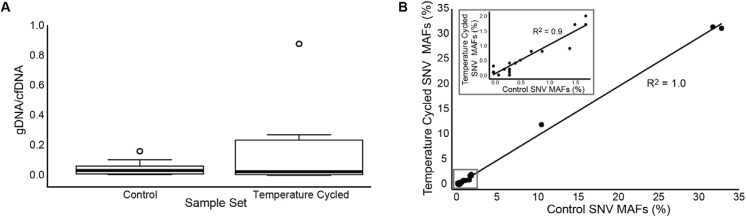
A) Extent of genomic DNA (gDNA from leukocytes) contamination in the control cell-free DNA (cfDNA) samples compared to prolonged temperature cycled samples sets represented as the ratio of gDNA (> 500 bps) to cfDNA (< 500 bps). Temperature cycled samples were incubated at 37°C for 8 hours followed by 16 hours at room temperature daily for 5 days. Control samples were processed immediately upon receipt at the laboratory. Center lines show the medians; box limits indicate the 25th and 75th percentiles as determined by R software; whiskers extend 1.5 times the interquartile range from the 25th and 75th percentiles, outliers are represented by dots. N = 10 sample points. B) Concordance of control sample set with prolonged temperature cycled sample set shown by a correlation plot of all mutant allele frequencies (MAFs) of the single nucleotide variants (SNVs) from the control sample set versus the corresponding SNV MAFs in the temperature cycled sample set. The total number of different SNVs plotted is 24. The inset shows the correlation of MAFs at less than or equal to 2% between the two data sets, showing excellent correlation even when SNVs are as low as 2.5%.