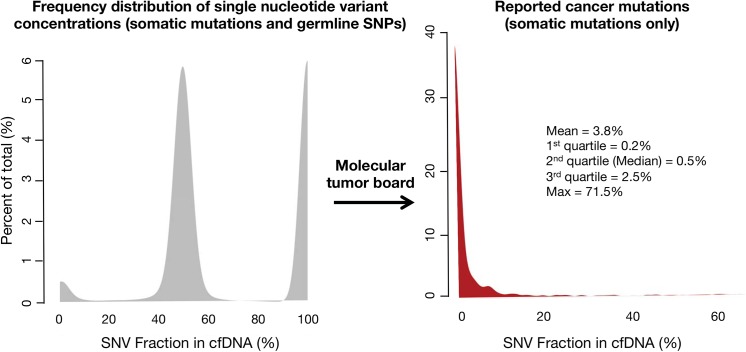
Fig 6. Frequency distribution of single nucleotide variant (SNV) mutant allele fractions (MAFs) for the first 1,000 consecutive patients tested in clinical practice (broad range of non-hematologic malignancies).
On the left the three peaks represent kernel distribution density plots of the frequencies of somatic and germline mutant allele fractions. By their low concentrations, somatic mutations (far left-hand small peak) can be generally distinguished from heterozygous germline SNVs around 50% MAF (middle peak) and homozygous germline SNVs around 100% MAF (right-hand peak). Cell-free DNA is both leukocyte-derived and tumor-derived, with the germline DNA generally representing the bulk of the cfDNA. On the Guardant360 panel the molecular tumor board filters out the germline SNVs and only the somatic mutations are reported. The red curve in the right-hand figure shows the frequency distribution of the MAFs for the somatic SNVs only. The long tail reflects the rare patients with a somatic mutation at high MAF.

