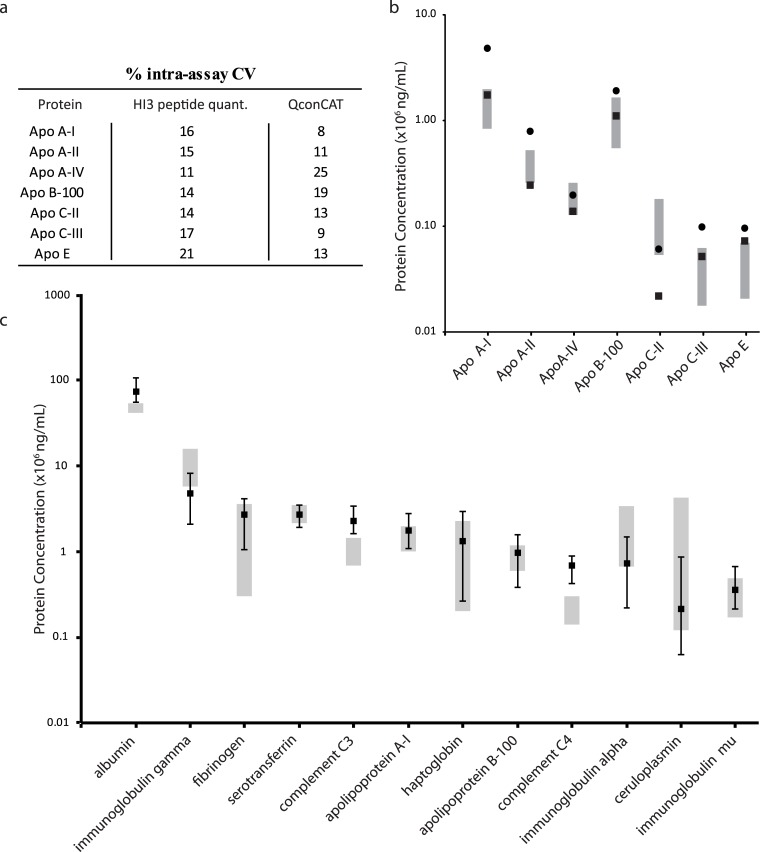
Fig 2. Quantitation of plasma protein concentrations by HI3, QconCAT and immunoassay.
(a) Intra-assay variation of apolipoproteins by HI3 and QconCAT on a single day of measurements. (b) Protein concentration quantified by HI3 peptide quantitation (squares) or QconCAT (circles) and their reference ranges (grey boxes) in 5 pooled plasma samples. (c) Median HI3 peptide quantitation (squares) in 31 samples apart from fibrinogen (n = 30) and complement C4 (n = 29), error bars indicate the minimal and maximum value measured in the plasma samples, while grey boxes indicate ranges quantified by immunoassays in the same samples.

