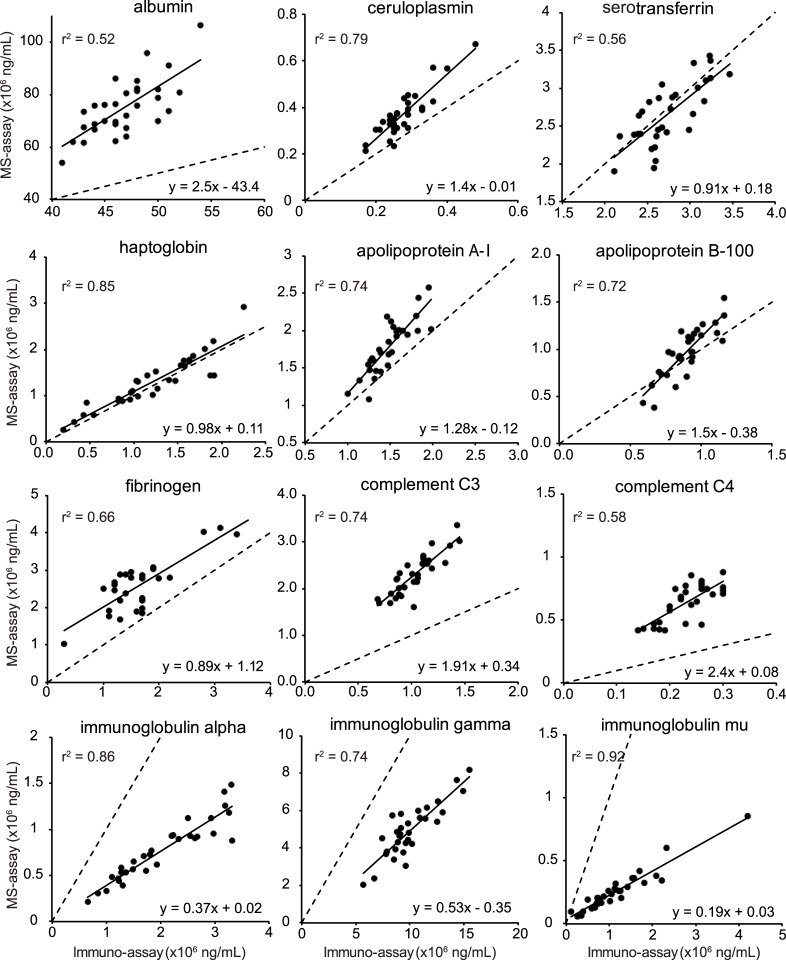
Fig 3. Correlation of concentrations obtained by either label free mass spectrometry or clinical immunoassay of 12 abundant plasma proteins.
Each dot represents the correlation between the protein concentration (g/L) of a single sample determined by clinical immunoassays (x-axis) and label free mass spectrometry (y-axis). Regression lines (solid black) obtained by ordinary least squares linear regression and the formulas describing them are shown. The dashed line, x = y, represents perfect correlation for comparison.

