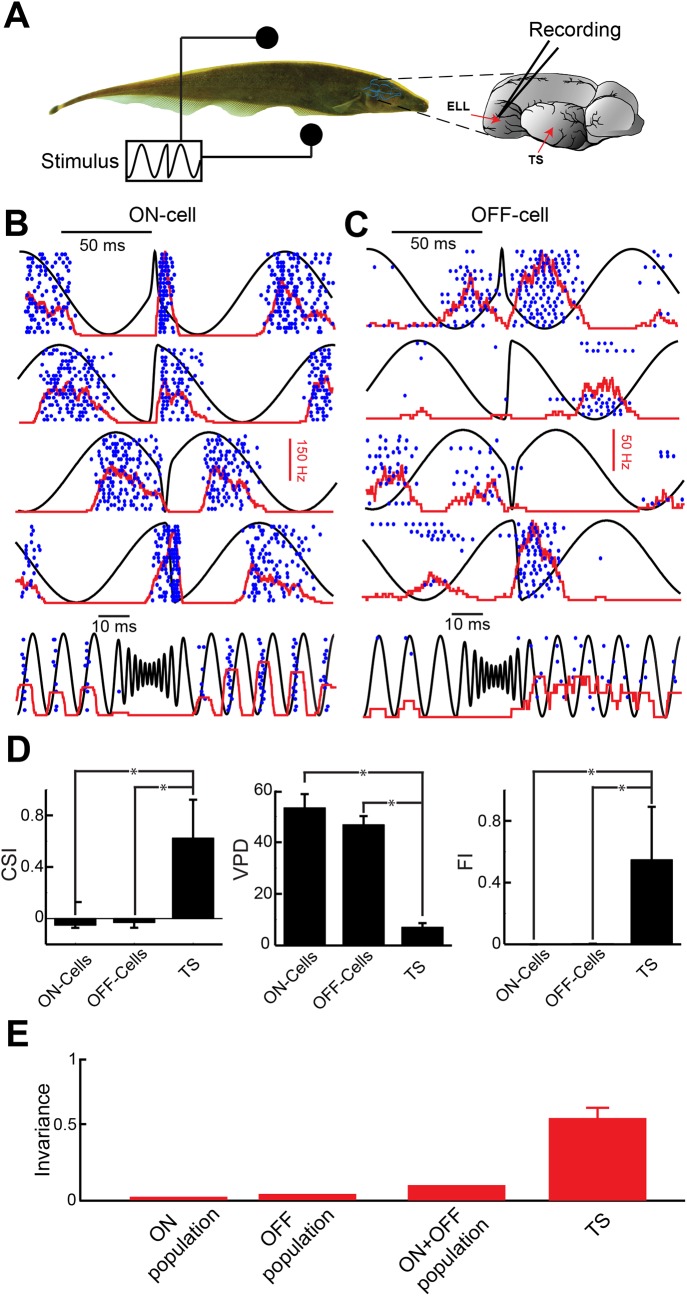
Fig 3. Hindbrain electrosensory neurons projecting to midbrain do not display feature invariant responses to natural electrocommunication stimuli.
A) Schematic showing a fish with stimulation electrodes on each side as well as a recording electrode from the hindbrain region Electrosensory lateral line lobe (ELL). B,C) Responses of example ON and OFF-type ELL pyramidal neurons to different chirp stimuli (black), respectively. The blue dots mark the occurrence of action potentials to 20 repeated presentations of the stimulus waveform (raster plot) and the red curve shows the firing rate response averaged over trials (PSTH). Note the different responses to chirps as a given cell responds sometimes with excitation and sometimes with inhibition. D) Population-averaged VPD (left), CSI (middle), and FI (right) values for ELL ON, OFF-cells, and TS neurons. “*” indicates statistical significance at the p = 0.05 level using a one-way ANOVA. Values for ON, OFF, and TS cells, respectively, are VPD = 53.3±5.3, 46.8±3.4, 7.4±1.9; CSI = -0.05±0.02, -0.03±0.04, 0.61±0.08; FI = 0.00±0.00, 0.004±0.004, 0.536±0.093. E) FI values obtained from the population-averaged responses for ON-cells, OFF-cells, and ON+OFF-cells are also shown and are all much lower than FI values obtained for TS neurons.

