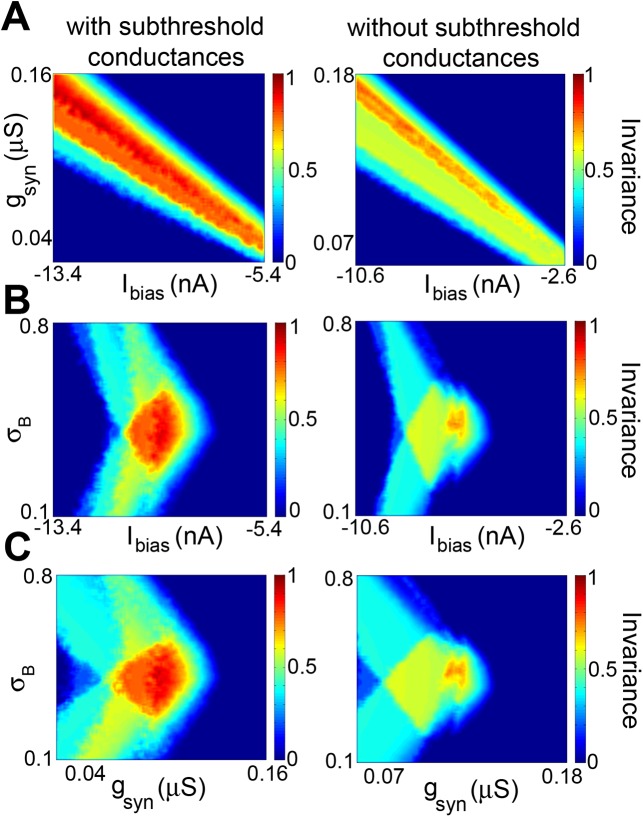
Fig 7. Subthreshold membrane conductances increase the set of parameter values for which feature invariance is observed.
A) Invariance as a function of I bias and g syn with (left) and without (right) the subthreshold membrane conductances g T and g h. Robustness (i.e. the % of pixels for which the feature invariance score FI was greater of equal to 0.7, see Methods) was 20% (left) vs. 4% (right). B) Invariance as a function of I bias and σ B with (left) and without (right) the subthreshold membrane conductances g T and g h. Robustness was 7.8% (left) vs. 0.5% (right). C) Invariance as a function of g syn and σ B with (left) and without (right) the subthreshold membrane conductances g T and g h. Robustness was 5.9% (left) vs. 0.3% (right). For the panels on the left, we had g T = 0.236 μS and g h = 2.1 μS whereas for those on the right, we had g T = g h = 0 μS. Other parameter values were g syn = 0.063, 0.128 μS; I bias = –9.39, –6.57 nA; and σ B = 0.42, 0.41 for the panels on the left and right columns, respectively.

