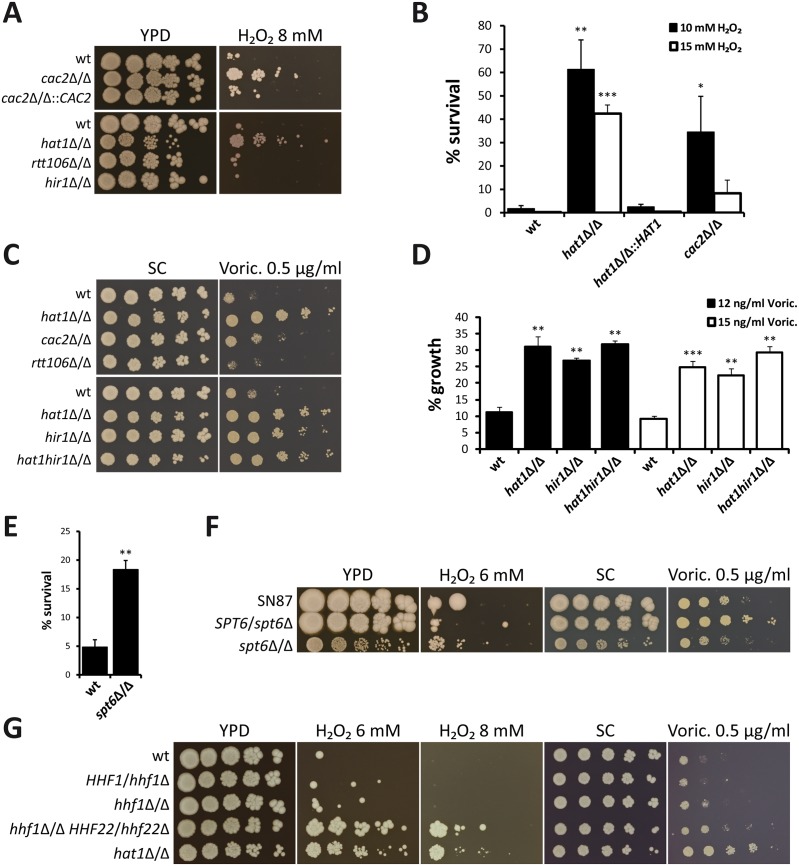
Fig 2. Lack of histone chaperones mimics deletion of HAT1.
(A) Loss of Cac2 increases H2O2 resistance. Deletion of RTT106 or HIR1 does not affect susceptibility to hydrogen peroxide. Fivefold serial dilutions of the indicated strains were spotted on agar plates containing the indicated substances and pictures were taken after incubation at 30°C for 3 days. (B) Deletion of HAT1 or CAC2 increases survival to transient hydrogen peroxide treatment. Exponentially growing cells were treated with the indicated concentrations of H2O2 for 2 hours. Cells were plated and colonies counted after 3 days of incubation on YPD plates at 30°C to determine viability. Data are shown as mean + SD from three independent experiments. (C) Deletion of HIR1 reduces voriconazole (Voric.) susceptibility. The hat1hir1Δ/Δ double deletion strain mimics lack of Hat1. Loss of Cac2 has only a minor effect and deletion of RTT106 does not alter azole susceptibility. Experiment was performed as described in (A). (D) Increased azole tolerance of hat1Δ/Δ, hir1Δ/Δ and hat1hir1Δ/Δ was confirmed using a liquid growth inhibition assay. Logarithmically growing cells were diluted into medium containing the indicated concentrations of voriconazole (Voric.) and incubated at 30°C for 18 hours. OD600 was determined and growth inhibition relative to untreated samples was calculated. Data are shown as mean + SD from three independent experiments. (E) Lack of Spt6 reduces H2O2 susceptibility. Experiment was performed as described in (B). Cells were treated with 10 mM H2O2. Data are shown as mean + SD from two independent experiments. (F) Deletion of SPT6 increases H2O2 resistance and azole tolerance. Fivefold serial dilutions of the indicated strains were spotted on agar plates containing the indicated substances and pictures were taken after incubation at 30°C for 5 days. (G) Reduction of histone gene dosage decreases H2O2 and azole susceptibility. Experiment was performed as described in (A). (B, D, E) *P<0.05, **P<0.01 and ***P<0.001 relative to the corresponding wild-type (Student's t-test).

