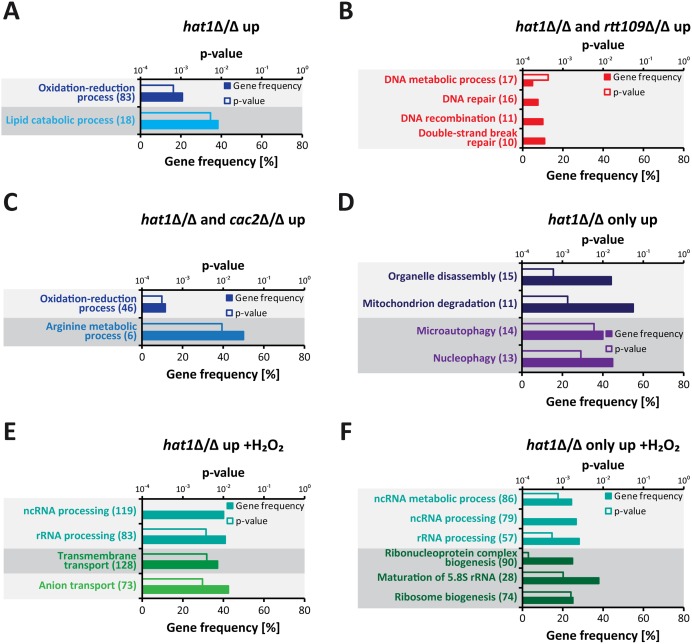
Fig 5. Specific functional gene groups are upregulated in cells lacking Hat1.
(A) GO terms enriched among 2-fold significantly upregulated genes in logarithmically growing hat1Δ/Δ cells are shown. (B) The plot shows GO terms found within genes significantly upregulated in the hat1Δ/Δ and rtt109Δ/Δ strains only. (C) GO terms enriched within genes significantly upregulated in the hat1Δ/Δ and cac2Δ/Δ strains only. (D) The panel shows GO terms found among genes significantly upregulated in the hat1Δ/Δ mutant only and not in the rtt109Δ/Δ and the cac2Δ/Δ strains. (E) GO terms enriched among significantly upregulated genes in hat1Δ/Δ cells after treatment with H2O2 are shown. (F) The plot shows GO terms found within genes significantly upregulated in the hat1Δ/Δ strain only and not in the rtt109Δ/Δ and the cac2Δ/Δ strains upon H2O2 treatment. (A-F) The corresponding p-values for the enrichment (empty bars) and the percentage of genes changed within the GO group (filled bars) are presented. The absolute number of regulated genes within a GO group is presented in brackets. Groups containing identical genes are depicted in the same color. Significantly regulated genes were defined by a p-value <0.05.

