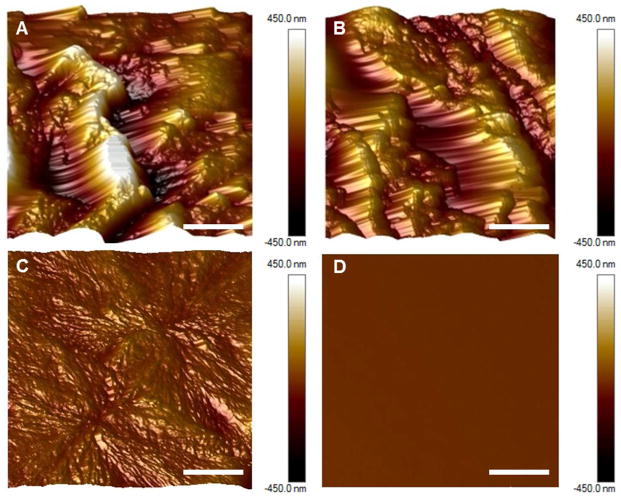
Figure 5.
Surface analysis of xSIBS, PCL, and PMMA. AFM images taken of 20 μm × 20 μm sections of (A) as-cast 25%-styrene xSIBs, (B) platelet-exposed 25%-styrene xSIBs, (C) PCL, and (D) PMMA (5 μm lateral scale bar). Ordered styrene cylinder peaks with globular isobutylene valleys were observed on xSIBS. PMMA exhibited the lowest roughness.

