
Fig. 2.
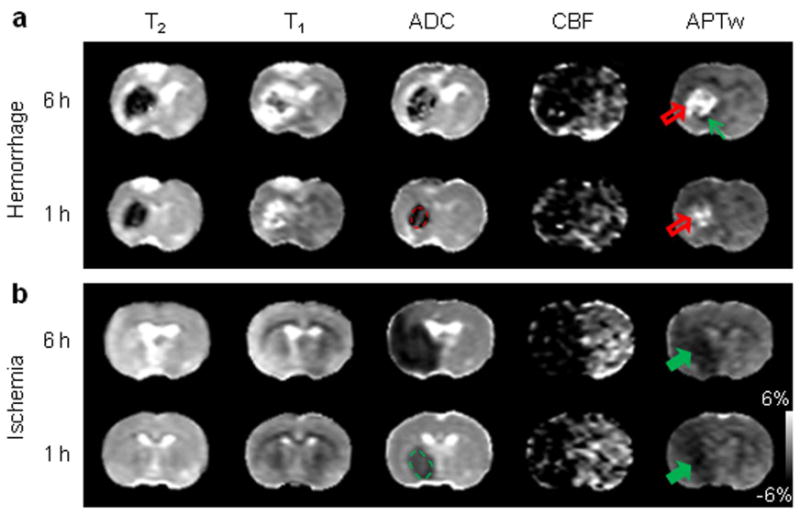
Comparison of multi-parametric MRI features of hyperacute ICH and cerebral ischemia. a: ICH at one and six hours after the injection of collagenase (red open arrow). b: Cerebral ischemia at one and six hours after occlusion of the middle cerebral artery (green solid arrow). The display windows are T2 (25 to 75 ms), T1 (1 to 2 sec), ADC (0.4 to 1.2×10⁻⁹ m2/sec), blood flow (0 to 120 ml/100g/min), and APTw (-6% to 6% of the bulk water signal intensity). ADC and CBF maps showed a primarily hypointense signal in both pathologies. Areas of perfusion abnormality are larger than areas of diffusion abnormality. APTw MRI showed hyperintensity in ICH (red open arrow), but hypointensity (green solid arrow) in cerebral ischemia at both time points. Possible perihematomal ischemia (APTw hypointense, green thin arrow) was seen at six hours post-injection. APT MRI provided a stark image contrast between ICH and cerebral ischemia at the hyperacute stage. Examples of regions of interest for quantitative image analysis are shown with yellow dashed lines.