
Fig. 5.
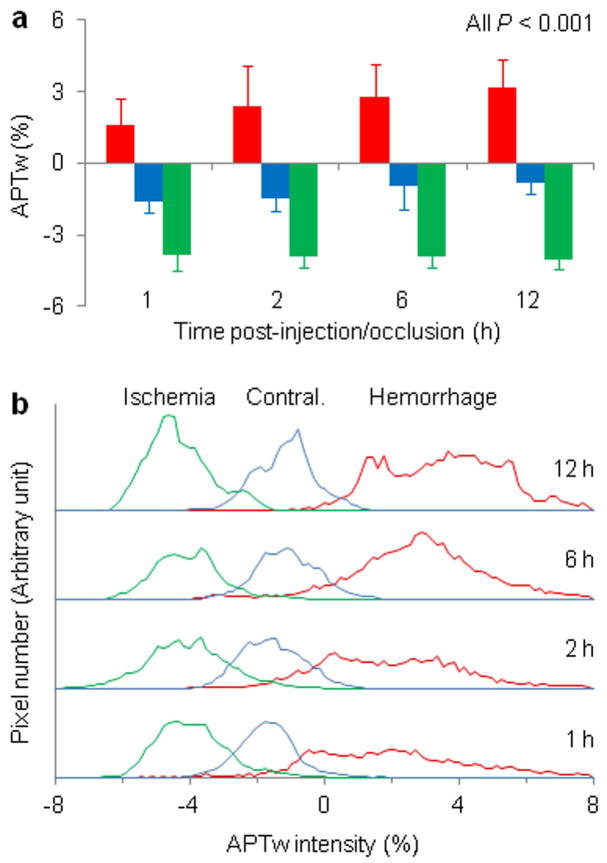
Quantitative analysis of APTw signal intensities (in percentage change of bulk water signal intensity) of hyperacute ICH and cerebral ischemia in rat models at several time points post-injection/occlusion (n = 10 each group). a: Comparison of average APTw signal intensities. Hyperacute ICH (red bar) and cerebral ischemia (green bar) showed opposite APTw MRI signals. With the saturation settings used in this study, the APTw signal in the contralateral brain tissue (blue bar) was slightly negative. b: Histogram analysis of APTw signal intensities. The histograms for these two pathologies demonstrated negligible overlaps at all time points.