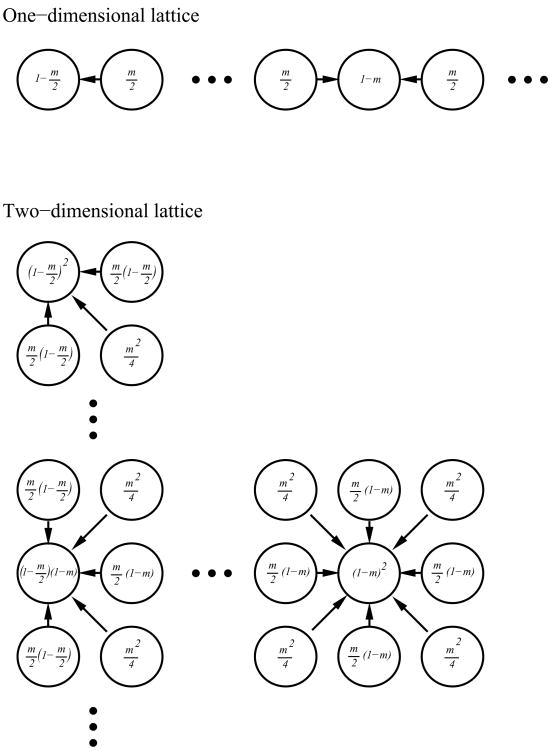
Figure 1.
Diagram of the migration pattern in a one- and two-dimensional stepping stone model. In each case the recipient population is shown together will all populations contributing migrants to it, with the fraction of the recipient population coming from each of these populations shown. This is shown for an interior population and a terminal population for the one-dimensial stepping stone model, and for an interior population, a side population, and a corner population for a two-dimensional stepping stone model.

