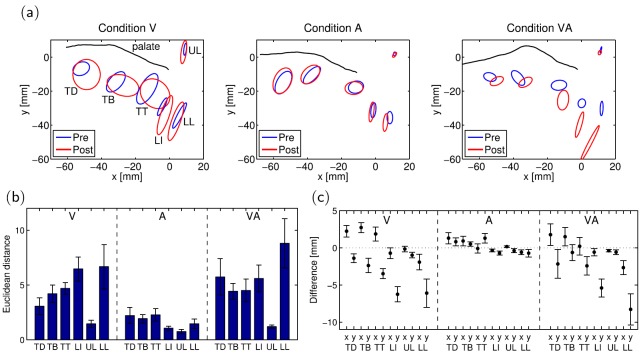
Fig. 3.
(Color online) (a) Articulatory distribution at the pre- and post-test phases for the participants in Fig. 2(a). (b) Euclidean distance between the pre- and post-test articulatory positions for each condition. (c) Difference (post- minus pre-test mean coordinates of each articulatory position) per condition.

