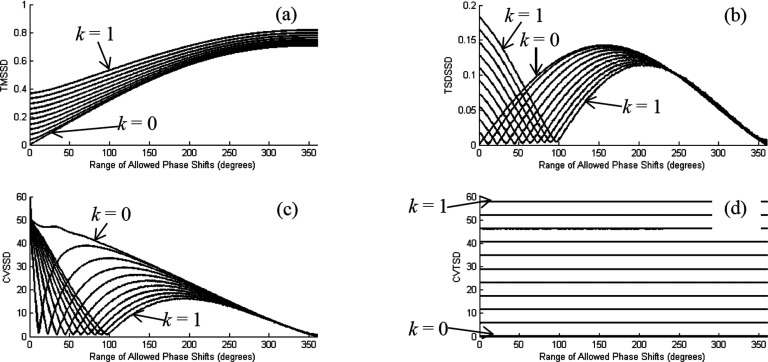
FIG. 7.
Combined dependence of the (a) TMSSD, (b) TSDSSD, (c) CVSSD and (d) CVTSD metrics on amplitude and phase heterogeneity of the model medium, for the C (i.e., k = 0) and U (i.e., k > 0) amplitude-distribution cases. The average value of the AC amplitude is 1 in all cases. Each plotted curve is the average across the 100 random assignments of phase shifts to the voxels. For the metrics that are not explicitly shown here owing to space limitations: the SSDTSD plot is qualitatively the same as CVTSD (only difference is the y-axis unit); SMTSD is a single zero-slope straight line; the shape of the TSDSM curve (which has no k-dependence) is similar to the TMSSD curve for k = 0, reflected about m = 180; and SCI is a single nonlinear curve (no k-dependence) that is equal to 1 at m = 0 and increases without bound as m approaches 360.

