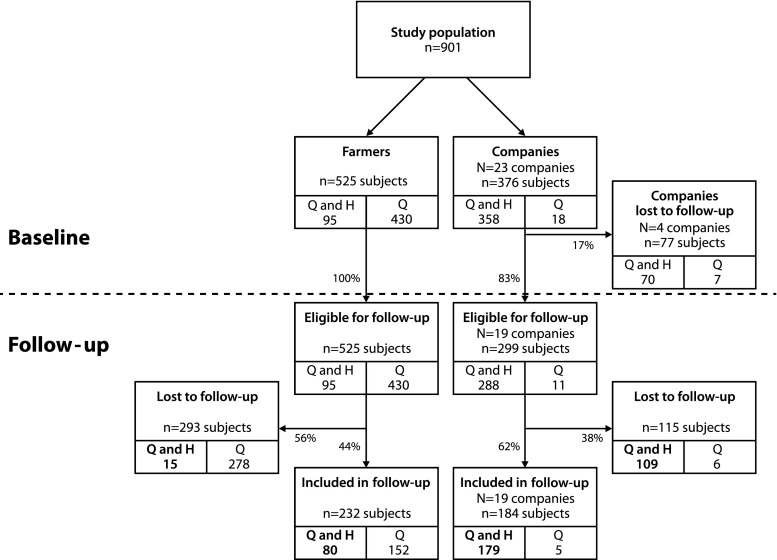
Fig. 1.
Flow chart of study population. Flow chart of study population from recruitment at baseline and eligible for follow-up till follow-up or loss to follow-up. Participants are categorized based on the information provided at baseline: questionnaire data (Q) and health exam (H). Several companies did not participate in follow-up and therefore subjects from those companies are not eligible for follow-up. For the present analysis, the main study population consists of participants who provided questionnaire and health exam information (‘Q and H’, bold)

