
Fig. 2.
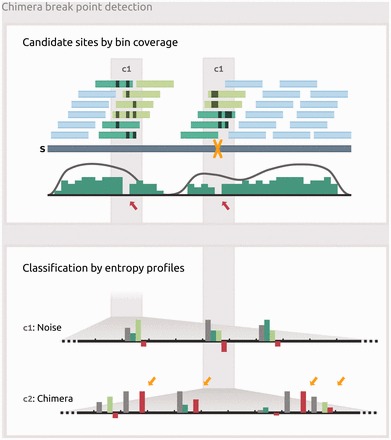
Detection of chimera break points. Box 1: Mapping of short reads (short light blue and green bars) onto pre-corrected long read (blue bar) containing a chimeric break point (yellow X); black strokes indicate non-matching alignment positions. While not detectable by per-base coverage (gray curve), break point candidate sites (c1, c2) can be inferred from decreases in bin coverage (green curve, red arrows). Reads overlapping candidate sites from the right hand side (dark green bars) and reads overlapping from the left hand side (light green bars) are considered for further classification of each individual site. Box 2: Entropy profiles derived from the short read alignment matrix at the two candidate sites. Each position comprises four entropy values: HT calculated from the entire read set (gray bar), HU for the reads placed upstream (dark green bar), HD for the reads placed downstream (light green bar) and ΔH (red bar). ΔH is the difference of HT and the greater value of HU and HD. An accumulation of positive ΔH values (yellow arrows) is observed at true chimera locations