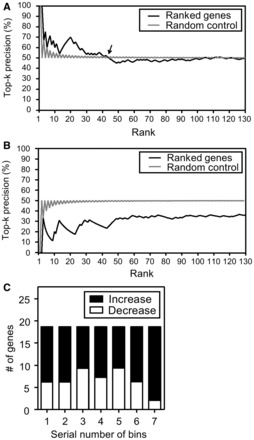
Fig. 3.

Characterization of genes in GRNs ranked by association with survival. (A) Top-k precision as a function of gene rank for GRNescc. The arrow points to the greatest rank where the precision is above random control (k = 44). (B) Top-k precision as a function of gene rank for GRNg-escc. (C) Relative proportion of CpGs with decreasing and increasing methylation from decreasing rank bins. Each bin contains 18 genes. Increase: methylation increased in tumor; Decrease: methylation decreased in tumor
