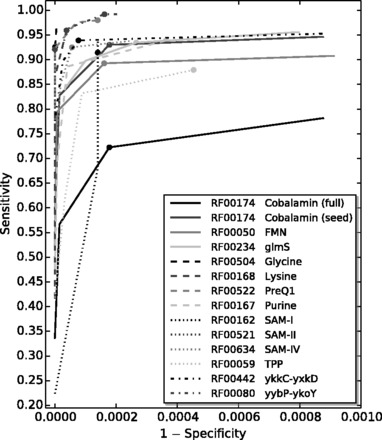
Fig. 4.

The receiver-operator characteristic curve for each riboswitch family correlating sensitivity values from Section 4.1 to on a representative sample of GenBank sequence records. The filled circle on each curve marks the value of S1 in that riboswitch’s default definition file
