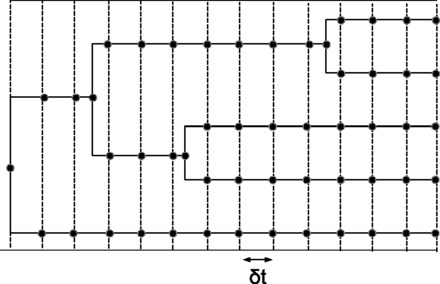
Fig. 1.

Discretization strategy. The Brownian process is explicitly sampled at all time points represented by black dots. Substitution rates and matrices are then approximated within each small time interval by the average of the values at both ends. See text for details
