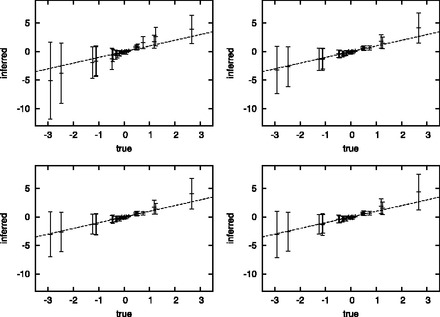
Fig. 3.

Estimated versus inferred covariances (non-diagonal entries of the covariance matrix), under the branchwise approximation (top left) or using the discretization strategy with P = 25 (top right), P = 100 (bottom left) and P = 200 (bottom right). Error bars are proportional to posterior standard deviation
