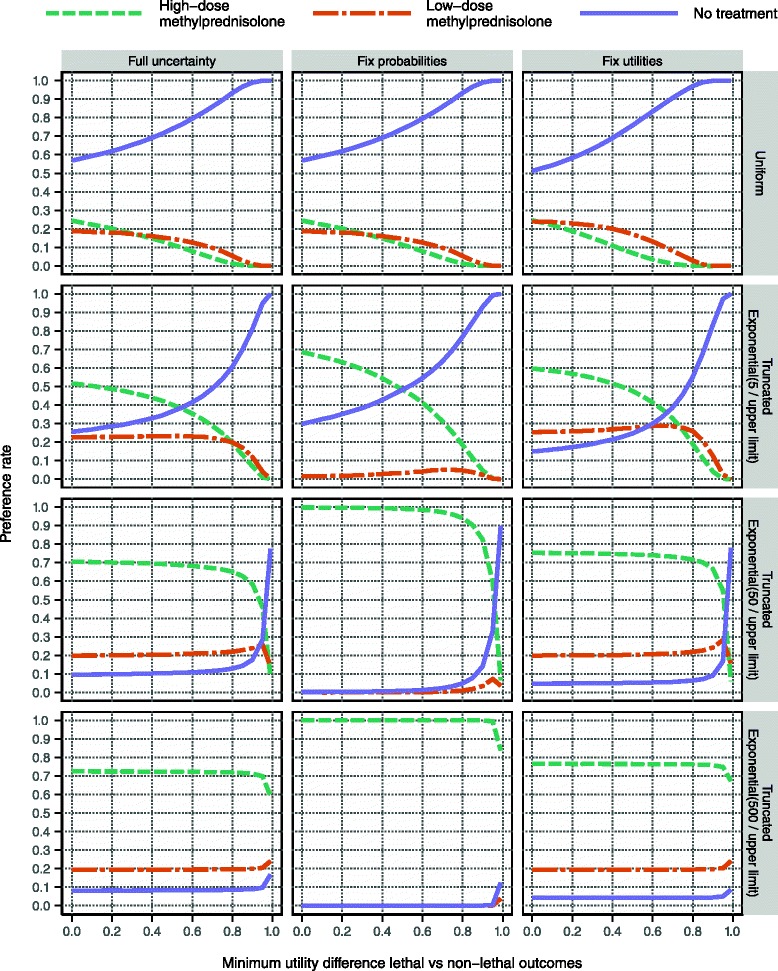
Fig. 12.

Evaluation with respect to various sources’ contribution to overall uncertainty. This display, like the one in Fig. 10, is based on the utility modelling for patients starting at EDSS 4. The background risk proportion for serious adverse effects is kept constant at zero, which means that the left column here is identical to the top row in Fig. 10. This reference is compared to two sets of analyses: the removal of all sampling uncertainty from probability variables and utility variables, respectively, in the middle and right columns. This fixation effect was achieved by replacing all sampled values of a particular variable by the median of the sampled values for that variable
