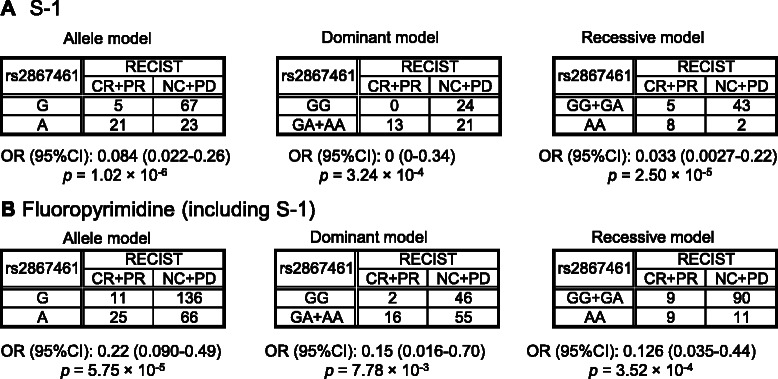
Fig. 2.

Contingency tables for rs2867461 in ANXA3 for each model using each dataset. a S-1-treated gastric cancer patients (first dataset). b Fluoropyrimidine (including S-1)-treated gastric cancer patients (second dataset). P values were calculated using Fisher’s exact test. OR: odds ratio, CI: confidence interval, RECIST: Response Evaluation Criteria in Solid Tumors, CR: complete response, PR: partial response, NC: no change, PD: progressive disease
