
Fig. 3.
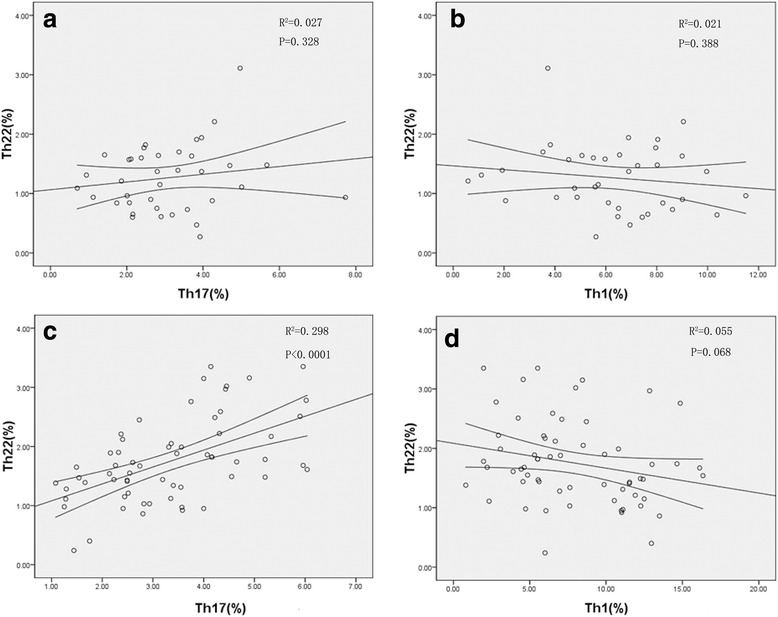
Correlations between Th subsets in CIN and CC patients. a The correlation between the levels of Th17 and Th22 cells in patients with CIN (r = 0.163, p = 0.328); b The correlation between the levels of Th22 and Th1 cells in patients with CIN (r = − 0.144, p = 0.388); c There was a positive correlation between Th22 cells and Th17 cells in CC patients (r = 0.546, p < 0.0001) d There was an approximately negative correlation between Th22 cells and Th1 cells in CC patients (r = − 0.235, p = 0.068).