Fig. 4.

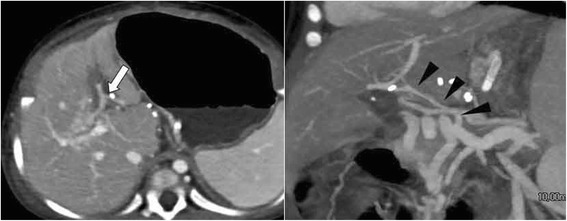
Follow-up computed tomographic angiography. Illustration: Follow-up computed tomographic angiography images showing increased portal flow (white arrow) via the preserved variant meso-Rex bypass (black arrowheads)

Follow-up computed tomographic angiography. Illustration: Follow-up computed tomographic angiography images showing increased portal flow (white arrow) via the preserved variant meso-Rex bypass (black arrowheads)