
Figure 1.
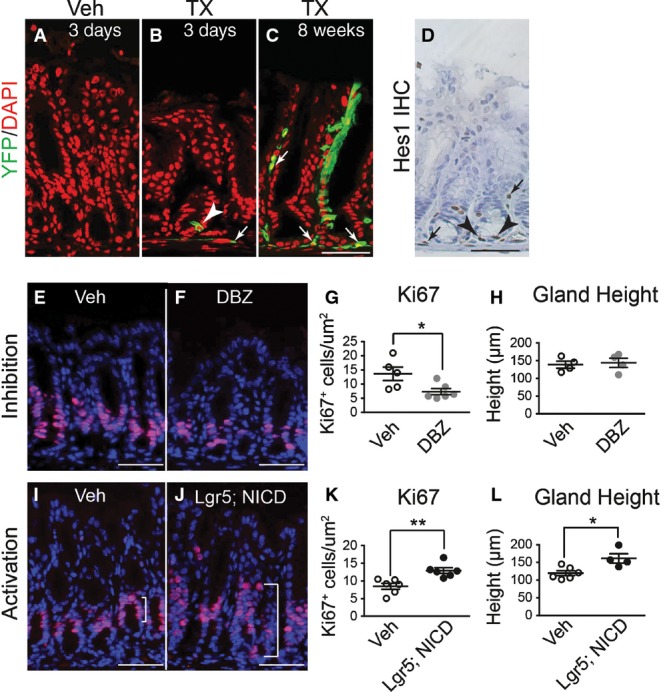
Antral stem cells express active Notch1 and are regulated by Notch signaling
- A–C Frozen tissue sections from the gastric antrum of vehicle- (A) or tamoxifen (TX)-treated (B and C) NIP1::CreERT2ROSAEYFP mice immunostained for YFP expression to evaluate lineage tracing 3 days (B) or 8 weeks (C) after treatment. Both epithelial (arrowhead) and mesenchymal (arrows) cells exhibit active Notch1 signaling (EYFP expression). DAPI (red) was used as a nuclear counterstain. Scale bar: 50 μm.
- D Paraffin section immunostained for HES1 showing both epithelial (arrowheads) and mesenchymal (arrows) cell expression. Scale bar: 50 μm.
- E–G Paraffin sections from (E) vehicle- (n = 5) or (F) DBZ-treated (n = 6) mice were immunostained for the proliferation marker Ki67 (red), and (G) the number of Ki67+ cells quantified (mean ± SE). DAPI (blue) was used as a nuclear counterstain. Scale bars: 50 μm. *P = 0.03 versus vehicle using Student's t-test.
- H Analysis of antral gland height in vehicle- (n = 4) or DBZ-treated (n = 4) mice (mean ± SE).
- I–K Paraffin sections from (I) vehicle- (n = 6) or (J) TX-treated (n = 6) Lgr5; ROSANICD mice were immunostained for the proliferation marker Ki67 (red), and (K) the number of Ki67+ cells quantified (mean ± SE). DAPI (blue) was used as a nuclear counterstain. Scale bars: 50 μm. **P = 0.004 versus vehicle using Student's t-test.
- L Analysis of antral gland height in vehicle- (n = 6) or TX-treated (n = 4) Lgr5; ROSANICD mice (mean ± SE). *P = 0.016 versus vehicle using Student's t-test.