
Figure EV1. Genetic Notch inhibition decreases cell proliferation and induces endocrine cell differentiation.
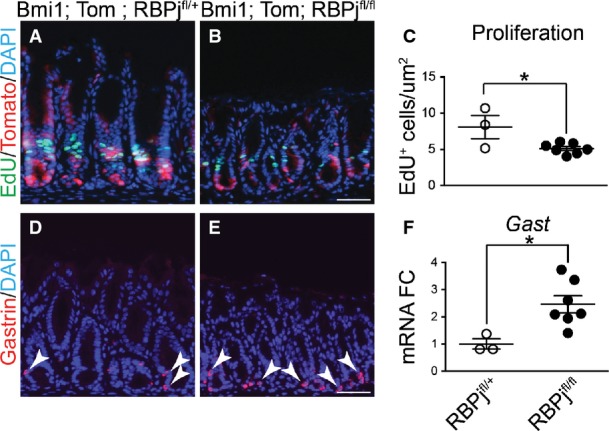
Bmi1; ROSATom; RBPjfl/+ (control; n = 3) and Bmi1; ROSATom; RBPjfl/fl (Notch-inhibited; n = 7) mice were treated with 100 mg/kg TX for 5 days and stomachs collected the next day.
- A–C Proliferation was measured in antral paraffin sections via EdU detection after incorporation for 2 h (mean ± SEM). *P = 0.023 versus RBPjfl/+ using Student's t-test.
- D, E Cellular differentiation was measured by immunostaining for gastrin-expressing endocrine cells. Scale bars: 50 μm.
- F Gastrin gene expression was measured by qRT–PCR analysis of antral RNA (mean ± SEM;n = 3–7 mice). *P = 0.02 versus RBPjfl/+ using Student's t-test.