
Figure 6.
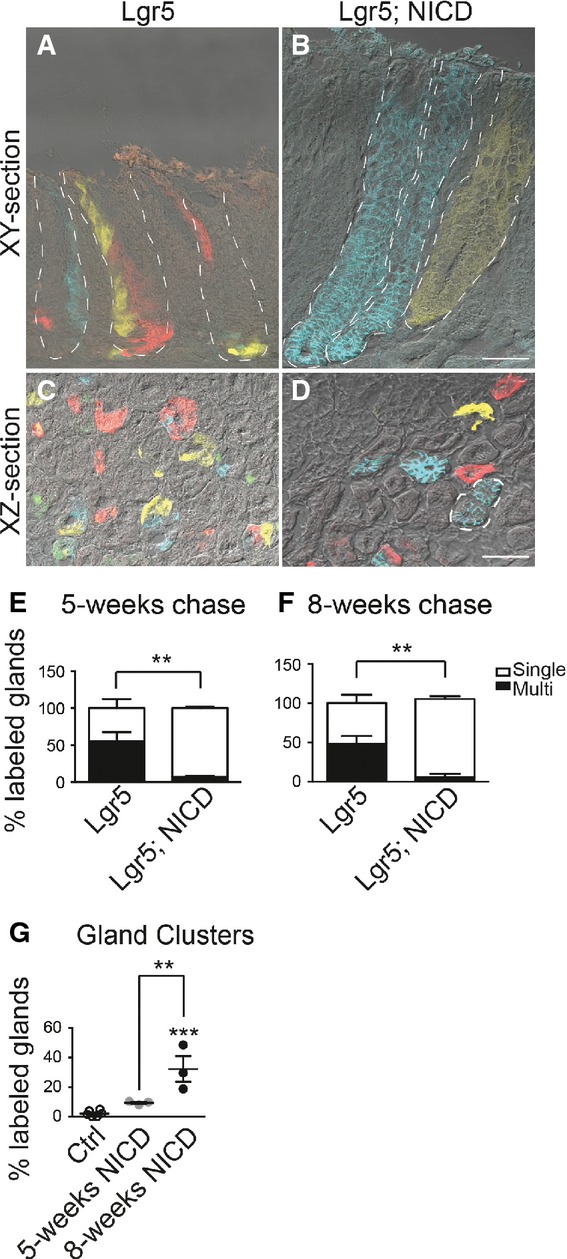
Notch activation induces clonal expansion of LGR5+ antral stem cells
- A–D Frozen tissue sections from Lgr5; ROSACon (Lgr5) (A, C) and Lgr5; ROSACon; ROSANICD mice (Lgr5; NICD) (B, D) imaged for native YFP (yellow), RFP (red), membrane-bound CFP (blue), and nuclear GFP (green) fluorescence using confocal microscopy. Tissue was analyzed 8 weeks post-TX. White dashed lines outline individual glands (A, B) or a gland cluster (D). Scale bars: 50 μm.
- E, F Quantification of antral glands composed of multiple or single Confetti colors in Lgr5; ROSACon and Lgr5; ROSACon; ROSANICD mice (mean ± SEM;n = 3 mice) 5 or 8 weeks post-TX. **P < 0.01 versus control using two-way ANOVA.
- G Quantification of single-colored clustered antral glands in Lgr5; ROSACon and Lgr5; ROSACon; ROSANICD mice (mean ± SEM;n = 3 mice) 5 or 8 weeks post-TX. Controls are pooled from both time points. ***P < 0.001 versus control, **P < 0.01 versus 5 weeks using one-way ANOVA.