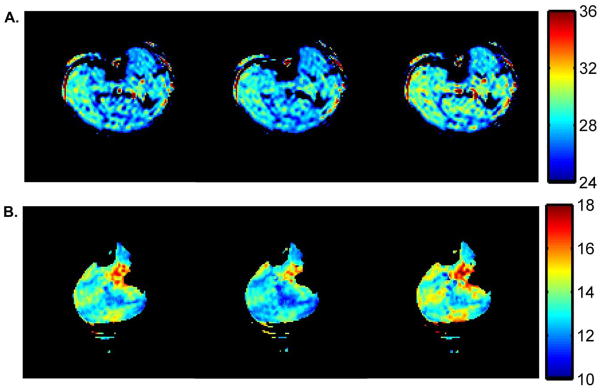
Figure 3.

Sample T2* maps from 3T (A) and 7T (B). The T2* maps reflect the T2* distribution prior to occlusion (left), at the end of occlusion (middle), and at the time of the peak T2* value following occlusion (right). The colorbars at right indicate the T2* in ms. A signal threshold was set so as to exclude curve-fitting in the noise regions of the original images. Due to the sensitivity profile of the partial volume coil used at 7T, this signal threshold also excluded data from areas of low signal in the leg.
