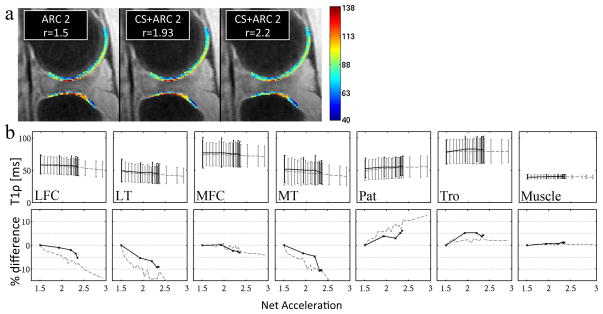
Figure 2.
(a) T1ρ color maps of the lateral tibia and femoral condyle measured in the ex vivo experiment. The color maps overlay on the image corresponding to TSL=0 (gray scale). (b) Top row: T1ρ measured in the simulation (dashed line) and in the ex vivo acquisition (solid line). Bottom row: Percent difference to the acquisition accelerated with ARC only.

