
Figure 2.
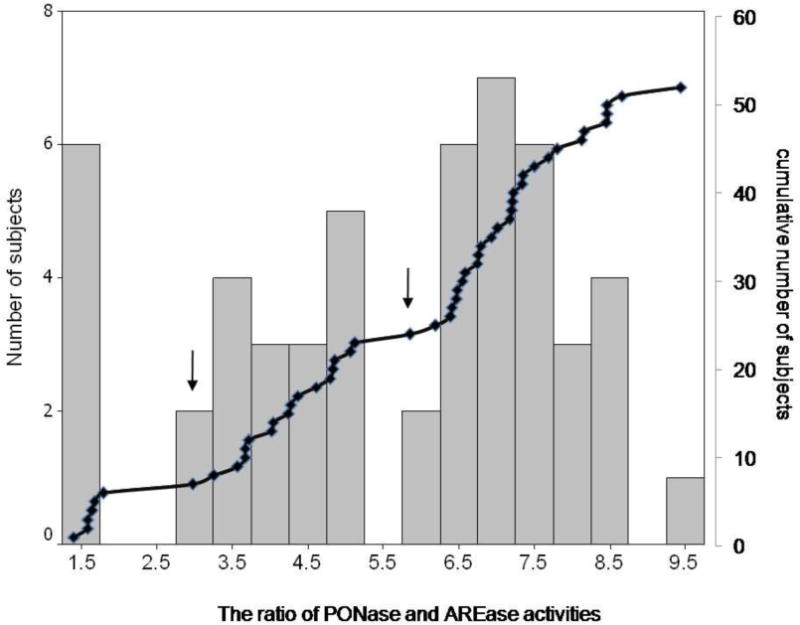
Distribution histogram and cumulative curve of the ratio of maternal paraoxonase and arylesterase activities from 52 participants. Arrows show points of the ratio that divided this population into three distinct groups according to their PON1 phenotypes.