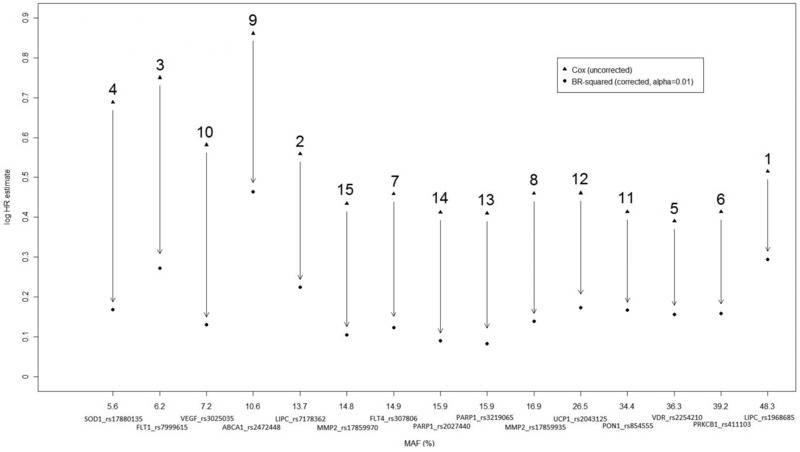
Figure 1.

Log HR estimates under a Cox proportional hazards model analysis of time to severe nephropathy for the top 15 SNPs in the DCCT/EDIC Genetics Study dataset, including 1,361 individuals. The horizontal axis corresponds to the minor allele frequency (MAF), with each SNP annotated with gene name and rs number. The number above each vertical arrow indicates the SNP ranking according to the P‐value of the original test of association (reported in Table 1). The vertical arrows quantify the reduction in the logHR by the genome‐wide bootstrap method: the percentage reduction varies with MAF from 43.1 (at MAF = 48.3%) to 80.5% (at MAF = 15.9%).
