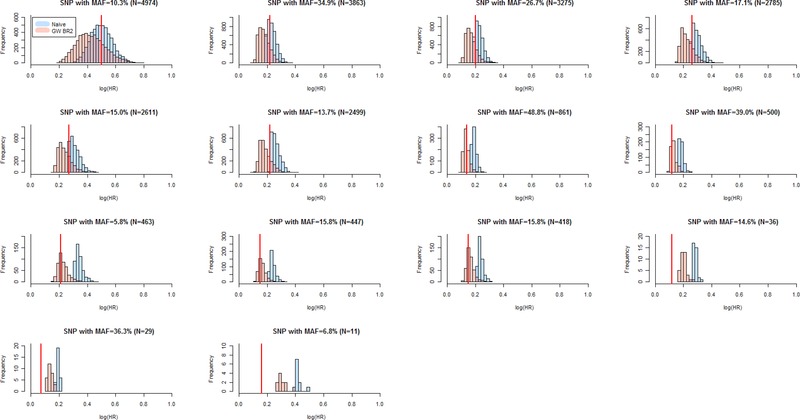
Figure 2.

Simulation Study 1 genome‐wide bootstrap estimates for true‐positive SNPs (significance threshold P < 5 × 10⁻⁵). Comparison of distributions of genome‐wide bootstrap (transparent red GW BR2) and uncorrected naive (transparent blue) logHR estimates of true‐positive SNPs with MAF ≥ 5% out of the 5,000 replications of a sample of 5,444 subjects. The vertical, solid red line denotes the fitted logHR averaged across unselected datasets. The SNPs are ordered by number of simulation datasets (N) in which the SNP was detected as statistically significant (see Table 2).
