
Figure 4.
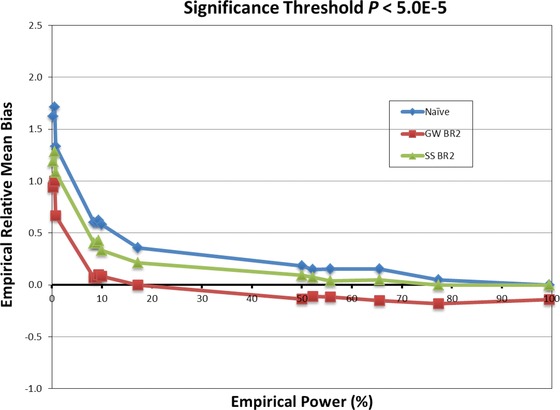
Simulation Study 1 relative mean bias comparison of the genome‐wide (GW BR2) and single‐SNP (SS BR2) bootstrap estimates with the naïve estimates for 14 SNPs with MAF ≥ 5% generated to have association with time to severe nephropathy in a sample of 5,444 subjects. Relative mean bias is calculated as Mean bias/mean fitted effect size, where means are taken over 5,000 replications (values derived from supplementary Tables S1 and S3).