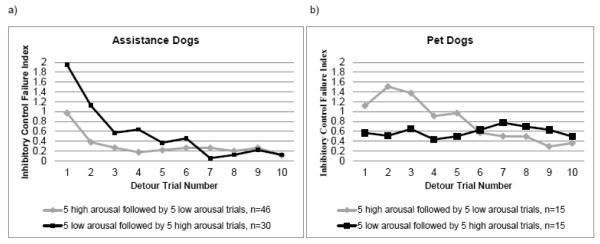
Fig. 3.

(A) Performance of assistance dogs on the detour arousal task by trial number and trial type. The lines represent the mean composite response score (touch + pathway + time to success), which is an inhibitory control failure index in which higher scores correspond to longer and less efficient problem solving. The gray line indicates dogs (n=46) who experienced order A, High Arousal First (5 high arousal detour trials followed by 5 low arousal detour trials), while the black line indicates dogs (n = 30) who experienced order B, Low Arousal First (5 low arousal detour trials followed by 5 high arousal detour trials); (B) Performance of pet dogs on the detour arousal task by trial number and trial type. The gray line indicates dogs (n=15) who experienced order A, High Arousal First, while the black line indicates dogs (n=15) who experienced order B, Low Arousal First
