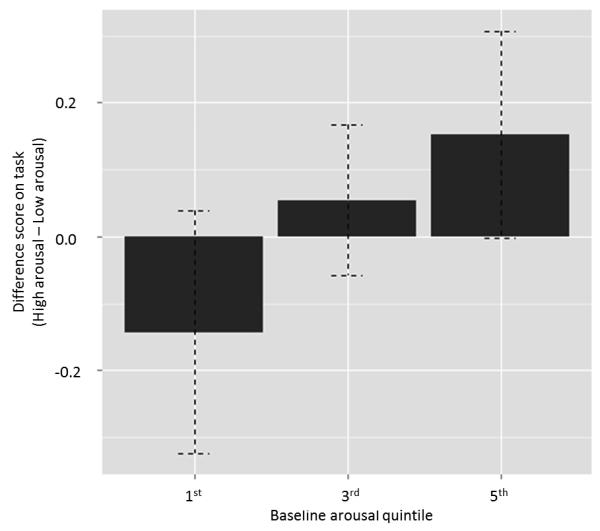
Fig. 5.
Average performance of dogs in the 1st quintile of baseline arousal (n=23), 3rd quintile of baseline arousal (n=21), and 5th quintile of baseline arousal (n=22). Baseline arousal was determined by tail-wagging rate during the familiarization walk-around, prior to the start of testing. Performance is shown as a difference score, acquired by taking the mean composite response score (touch + pathway + time to success) for high arousal trials and subtracting the mean composite response score for low arousal trials. Negative scores correspond to better performance under high arousal conditions, scores close to zero correspond to no strong difference between conditions, and positive scores correspond to better performance under low arousal conditions.

