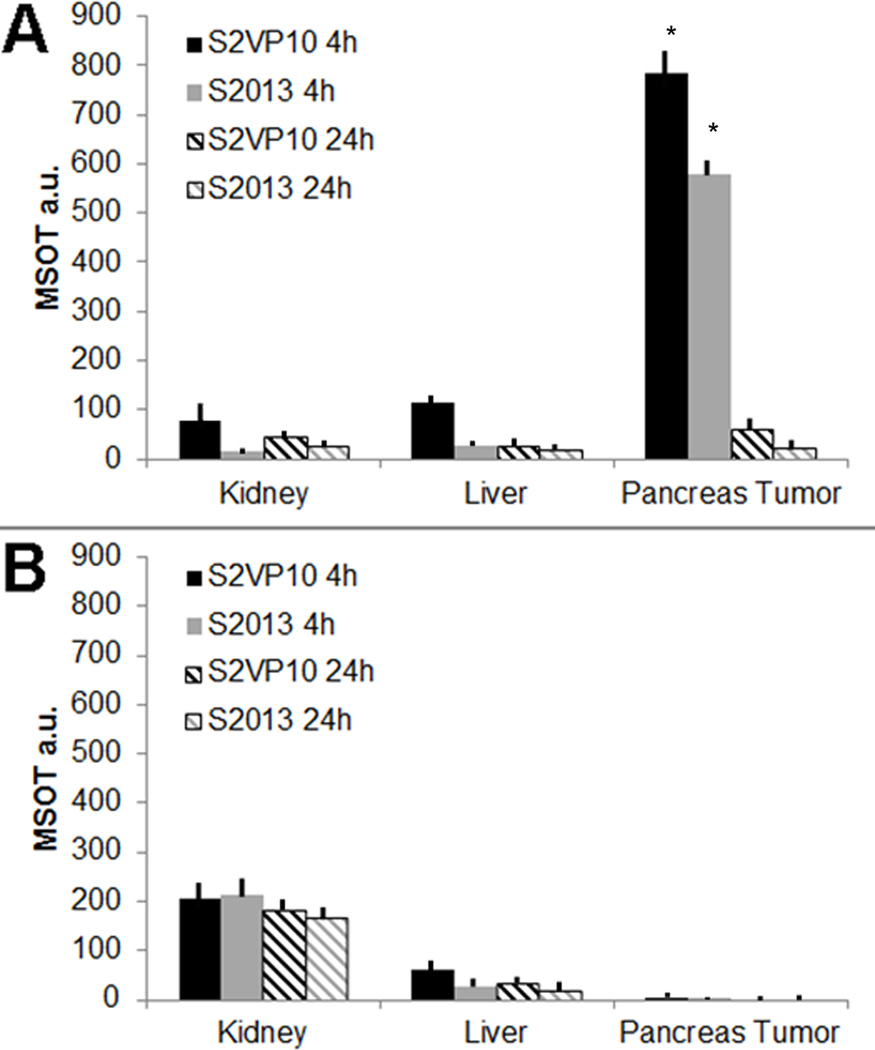
Figure 4.
Comparison of MSOT signal intensity of probe accumulation among organs. A region of interest method was utilized using an elliptical ROI of 3.5 mm2 in a region of pancreas tumor, liver, and kidney was utilized to determine the mean signal intensity for each ROI in each slice. (A) The highest ROI mean signal intensity for each organ and each mouse was averaged among 3 mice per cell line injected with V7–750 probe. The V7–750 probe resulted in 782.5 MSOT a.u. in S2VP10 mice and 578.3 MSOT a.u. in S2O13 mice at 4 h, but was greatly reduced to 73.5 and 34.2 MSOT a.u. at 24 h. (B) The highest ROI mean signal intensity for each organ and each mouse was averaged among 3 mice per cell line injected with K7–750 probe. The K7–750 probe accumulated within the kidney and only resulted in very limited pancreas tumor accumulation in either S2VP10 (5.3 MSOT a.u.) or S2013 (5.1 MSOT a.u.) models.

