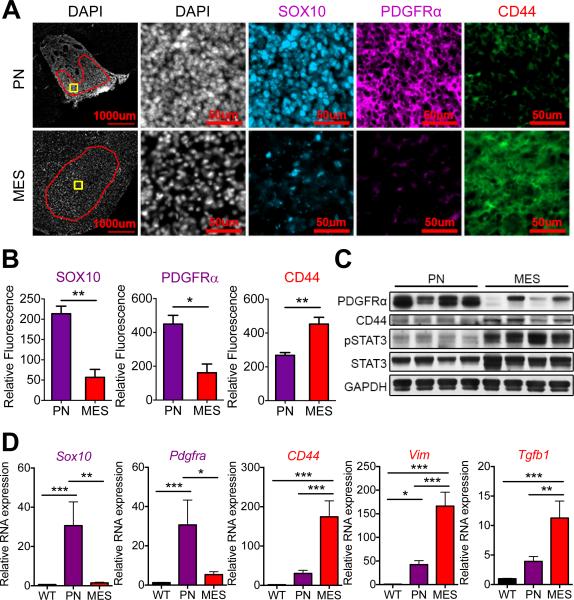
Figure 1. OPC- and astrocyte-derived transgenic murine glioma models display proneural and mesenchymal characteristics, respectively.
(A) Immunofluorescence of proneural markers (SOX10, PDGFRα) and mesenchymal marker (CD44) in OPC-derived HGG model (ERB/p53−/−; PN) and astrocyte-derived glioma model (G-RAS; MES). Red region of interest exclude necrotic regions and tumor edges for relative fluorescence quantification. Yellow boxes indicate regions shown in higher magnification images in (A). Scale bars: 1000 μm and 50 μm. (B) Fluorescent intensity quantification of SOX10, PDGFRα and CD44 in tumors (region of interest marked red in (A)) in proneural (purple) and mesenchymal (red) murine glioma models. (C) Immunoblotting for PDGFRα, CD44, and phosphorylated STAT3 of whole brain lysates from mice with proneural and mesenchymal gliomas. (D) Relative mRNA expression by RT-PCR of proneural genes Sox10 and Pdgfra, and mesenchymal genes CD44, Vim and Tgfb1 in isolated proneural (purple) and mesenchymal (red) tumors compared to normal wild-type (WT) mouse brain. * P < 0.05, ** P < 0.01, *** P < 0.001.

