
Figure 4. AZD4547 and MTOR inhibitor, AZD2014, alone and combined on growth of H1581 and Colo699 cells.
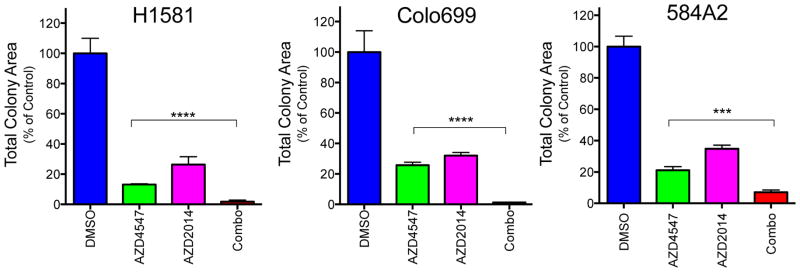
H1581, Colo699 and 584-A2 cells were submitted to anchorage-independent growth assays with 100 nM (H1581) or 300 nM (Colo699, 584-A2) AZD4547 with or without 100 nM AZD2014. After 14–21 days, viable colonies were stained with NBT and total colony area was measured as described in the Materials and Methods. The data were normalized to DMSO control treatments and are the means and SEM (n=3) where **** indicates p<0.0001.