
Figure 3.
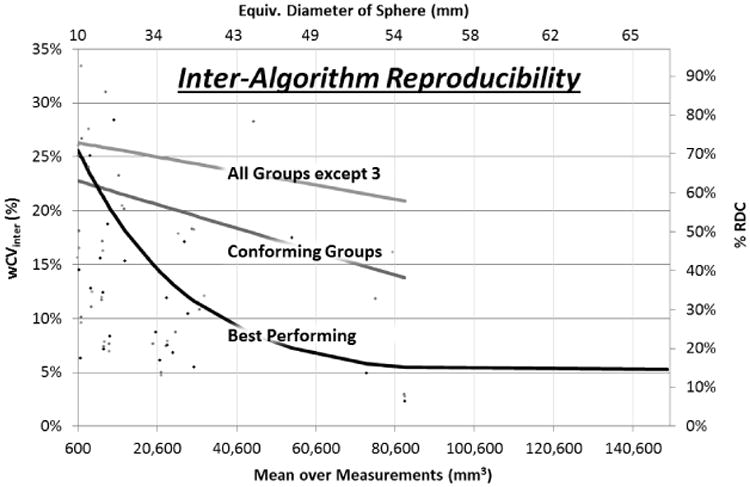
Results of inter-algorithm reproducibility analysis plotted across tumor size range. Line fits follow exponential functions. The fit lines are truncated where they would imply better performance than the sparse set of points at high tumor volumes actually suggest.