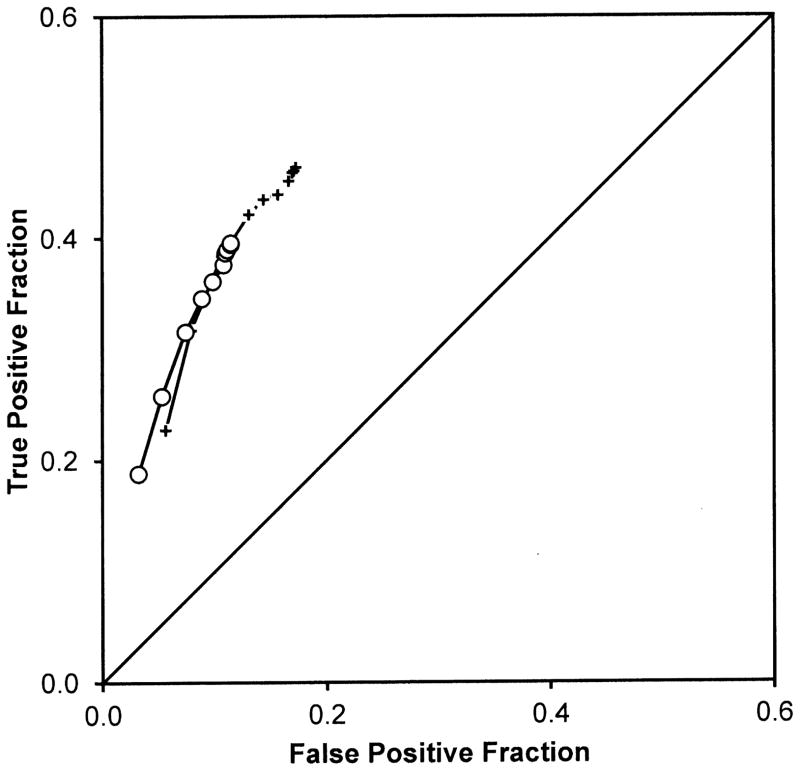
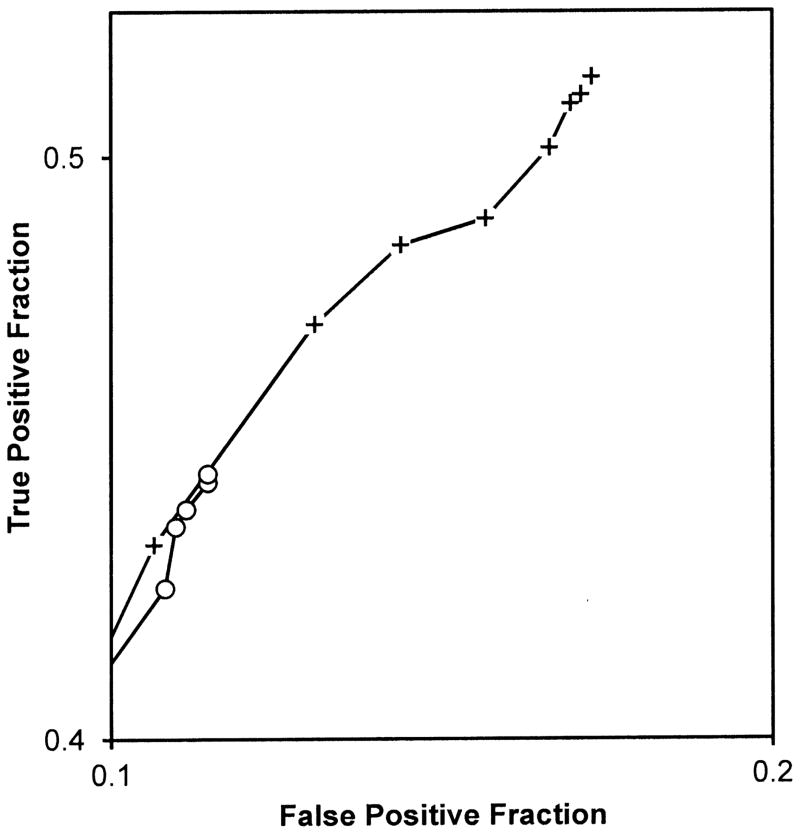
Figure 2.
Figure 2A. Each point is the average of 20 readers. Cross symbols represent ROC points from the non-SOS condition and open symbols represent ROC points from the SOS condition. These points suggest that detection accuracy as measured by ROC curves through the points would not differ between the conditions.
Figure 2B provides a magnified view of the most lenient operating points in Figure 2A to highlight differences in those points between the treatment conditions. Each point is the average of 20 readers. Cross symbols represent ROC points from the non-SOS condition and open circle symbols represent ROC points from the SOS condition. These points suggest a major threshold shift toward more conservative reporting in the SOS condition. (Note that the chance line shown in the other figures is not visible in this Figure because the ranges of true and false positive fractions do not overlap in the magnified view).


