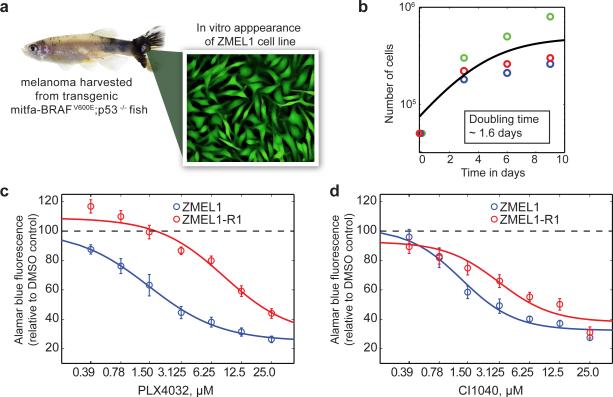
Figure 1.
Derivation and characterization of the ZMEL1 zebrafish melanoma cell line. a) Representative melanoma bearing fish (left) from the MiniCoopr background which mosaically expresses BRAFV600E in a mitfa-GFP;p53−/− background, and yielded the stable cell line ZMEL1, which is uniformly GFP positive. b) Growth curves of the ZMEL1 line demonstrate a population doubling time of 1.6 days. Individual colors representative replicate experiments. c,d) The response of the ZMEL1 and ZMEL-R1 lines to either the BRAFV600E inhibitor PLX4032 (c) or the MEK inhibitor CI1040 (d). The resistant line demonstrates an 8-fold increase in the EC50 to the BRAF inhibitor, but only a 2-fold increase in the EC50 to the MEK inhibitor.

