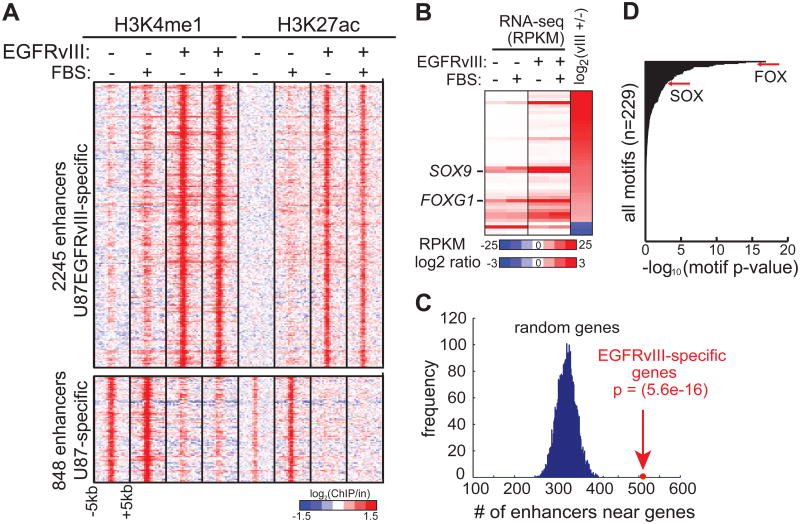
Figure 1. Integrative Analyses of Chromatin and Transcriptional Landscape Induced by Hyperactivated EGFR in GBM.
(A) Heat map of ChIP-seq experiments using antibodies against H3K4me1 and H3K27ac, two histone modifications associated with poised and active candidate enhancers, in U87 and U87EGFRvIII cells. The presence of EGFRvIII results in the activation and silencing of distinct sets of enhancers. Note that these potential enhancers show little response to 10% fetal bovine serum (FBS), which contains various growth factors.
(B) Heat map of RNA-seq experiments shows the transcript levels of TF genes differentially expressed between U87 and U87EGFRvIII cells (see also Figure S1).
(C) EGFRvIII-responsive enhancers are located near EGFRvIII-specific genes.
(D) Motif enrichment analysis indicates that FOX and HMG/SOX binding motifs are enriched in EGFRvIII-specific enhancers.
See also Figure S1 and Table S4.

