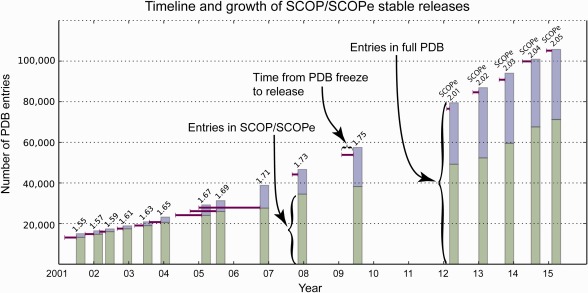
Figure 1.

Timeline of releases showing the number of structures in the PDB and SCOP/SCOPe at each release date. The extended horizontal lines start at the PDB freeze dates for each release and indicate the time required to release each version. The height of each vertical bar corresponds to the number of structures in the PDB on the release date, and the height of the horizontal line on the bar corresponds to the number of structures in the PDB on the freeze date. The bottom portion of each bar measures the number of PDB entries classified in each version of SCOP or SCOPe. Releases through 1.71 were comprehensive—all structures at the freeze date were classified, though the last comprehensive release, 1.71, was released 21 months after the freeze date. Releases since then have not been comprehensive. [Color figure can be viewed in the online issue, which is available at wileyonlinelibrary.com.]
