Fig. 4.

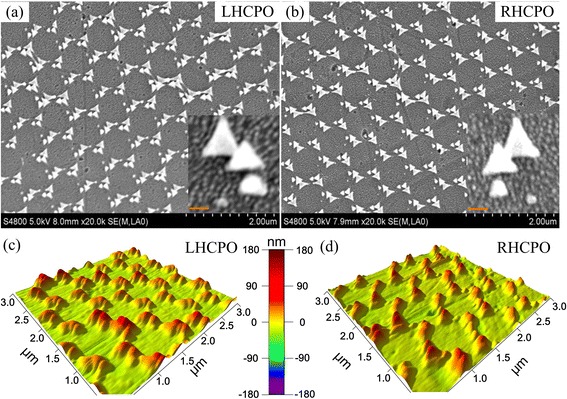
The measured SEM and AFM images of LHCPO and RHCPO with θ = 20°, k 1, 2, 3, 4 = 8, 25, 40, and 55 nm, respectively, and ΔΦ = ±60°. a, c From LHCPO. b, d From RHCPO. The insets in a and b are the enlarged images of one CPO

The measured SEM and AFM images of LHCPO and RHCPO with θ = 20°, k 1, 2, 3, 4 = 8, 25, 40, and 55 nm, respectively, and ΔΦ = ±60°. a, c From LHCPO. b, d From RHCPO. The insets in a and b are the enlarged images of one CPO