Fig. 6.

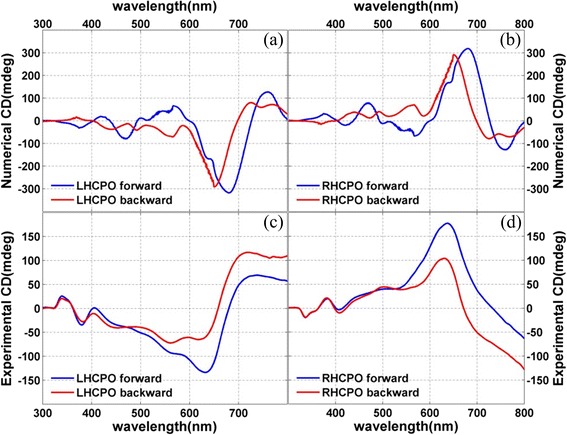
The simulated and experimental CD spectra. a, b Simulated CD spectra of LHCPO and RHCPO. c, d Measured CD spectra of LHCPO and RHCPO. The blue and red curves refer to the light incidence from the forward and backward sides of the samples

The simulated and experimental CD spectra. a, b Simulated CD spectra of LHCPO and RHCPO. c, d Measured CD spectra of LHCPO and RHCPO. The blue and red curves refer to the light incidence from the forward and backward sides of the samples