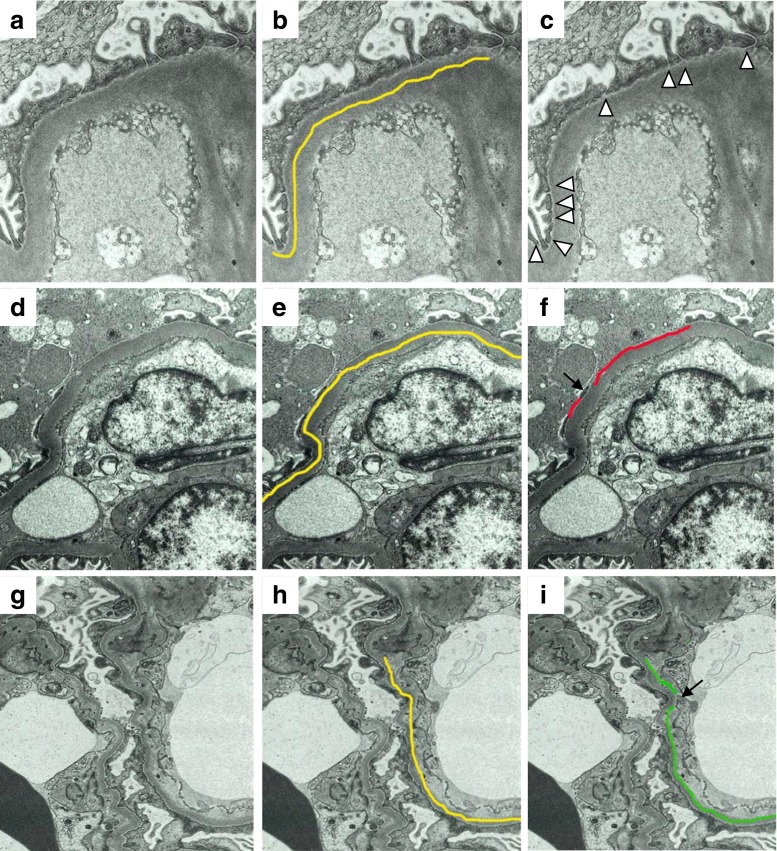
Fig. 1.
Electron micrographs (a–i), illustrating the measurement of the foot process width (FPW; a–c), the length of podocyte detachment (PD; d–f), and the subendothelial widening (SW; g–i) of the glomerular basement membrane in the kidneys that were obtained from patients with the tip (TIP; a–c), not otherwise specified (NOS; d–f) and cellular (CEL; g–i) variants of FSGS. b, e, h Length of the glomerular basement membrane (GBM) on electron microscopy determined by the morphometric analysis (yellow line). c An electron micrograph illustrating the separations of the foot processes (arrowheads). f An electron micrograph illustrating the measurement of the length of GBM with podocyte detachment by two red lines. A podocyte is intact in the area between the red lines (arrow). i An electron micrograph illustrating the measurement of the length of GBM with subendothelial widening by two green lines. GBM between the green lines is the area where subendothelial widening is not present (arrow)

