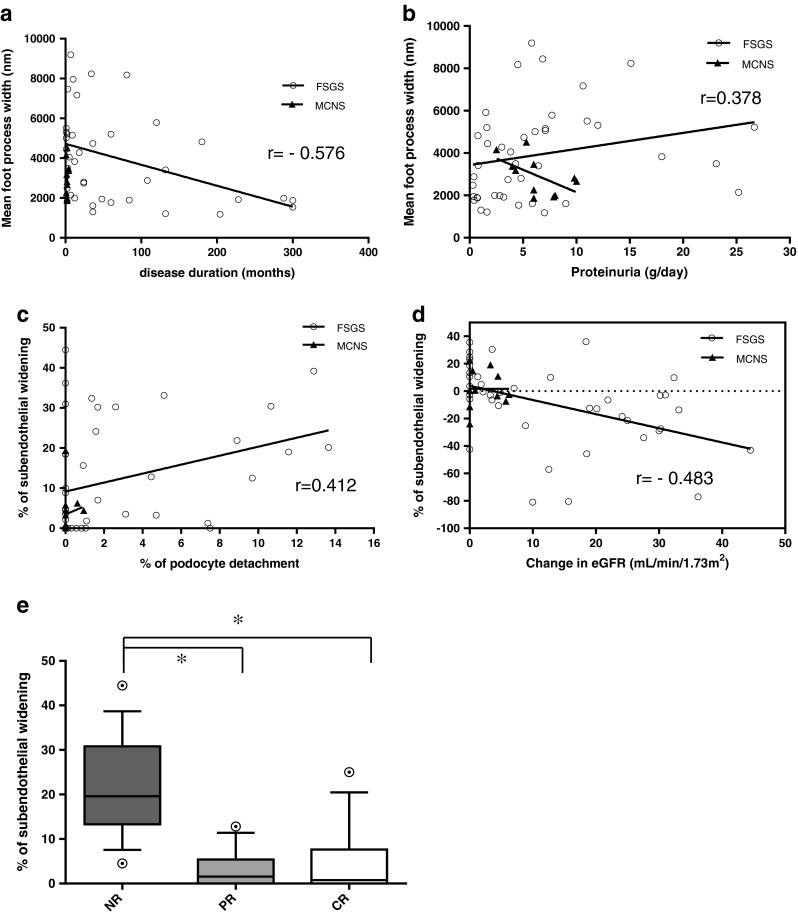
Fig. 4.

a Correlation between disease duration and mean foot process width in individual patients with FSGS (white circles) and MCNS (black triangles). b Correlation between proteinuria at the time of biopsy and mean foot process width in individual patients with FSGS (white circles) and MCNS (black triangles). c Correlation between percent of GBM length with podocyte detachment (% of podocyte detachment) and percent of GBM length with SW (% of subendothelial widening) in individual patients with FSGS (white circles) and MCNS (black triangles). d Correlation between change in eGFR and percent of GBM length with SW (% of subendothelial widening) in individual patients with FSGS (white circles) and MCNS (black triangles). e Percent of GBM length with SW (% of subendothelial widening) according to treatment response (NR non-response, PR partial remission, CR complete remission). The % of subendothelial widening was significantly increased in NR samples compared with PR or CR samples (*P < 0.05). The horizontal line in the middle of each box indicates the median; the top and bottom borders of the box mark the 75th and 25th percentiles, respectively; the whiskers mark the 90th and 10th percentiles; and the circles indicate outliers. Analysis of variance followed by the Tukey post hoc test was used for the statistical analysis
