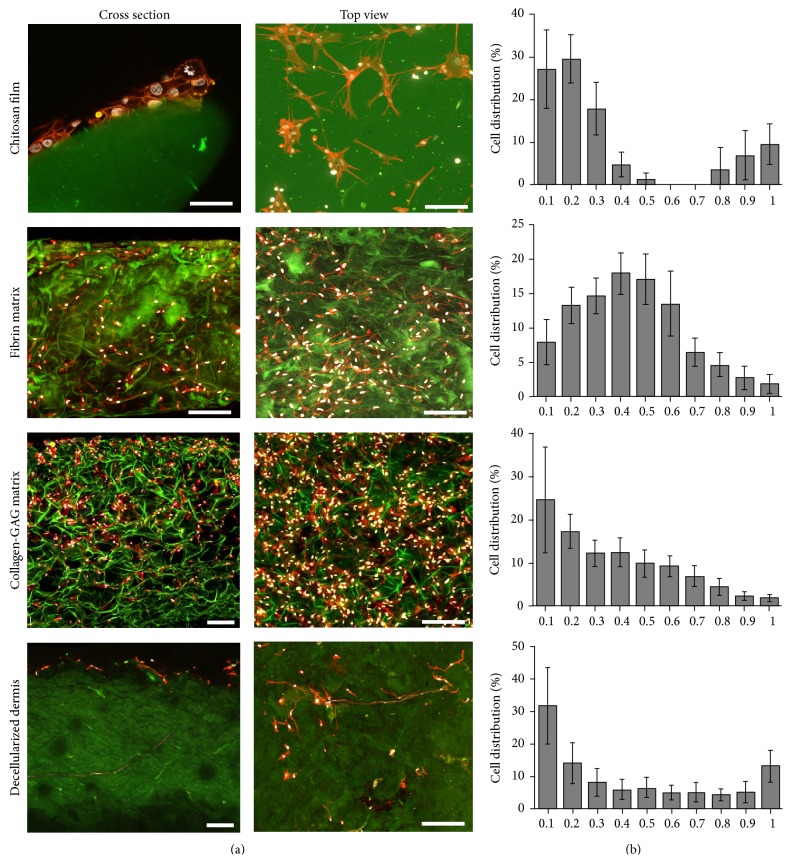
Figure 3.
Cellular distribution and attachment of cells on scaffolds. After seeding, the distribution and attachment of the cells was evaluated by LSM. In all cases, except for the decellularized dermis, AdMSCs (To-Pro-3 (white)/phalloidin (red)) adhered to the scaffold (green autofluorescence) showing a fibroblast like morphology. As can be seen in the first column, cells formed a layer over chitosan films while the others cells were able to migrate further into the scaffold. Cross section (right) and top view (left) of scaffolds. Scale bar represents 150 μm (a). Quantification of the cellular densities after 1 d throughout sections, ranging from the top (0.1) to the bottom (1) of the scaffolds as seen in confocal imaging (b). n = 3, N = 3.

